Not all solar power systems are created equal, they have varying degrees of efficiencies and sizes. But we also know not all environmental conditions are created equal. If you put two solar panels in different geographical locations, one can outperform the other by a long shot.
Ultimately, it’s the power from the sun that feeds energy to the solar panels where the power gets converted into electricity. Different regions on earth get varying degrees of sunlight intensity. Environmental factors such as climate and pollution can impact the intensity of sunlight received by the solar array.
Peak sun allows us to measure the amount of sun a geographical region gets throughout the year so solar systems can be sized properly.
Table of Contents
What Are Peak Sun Hours
Peak sun hours (PSH) are defined as the average hours per day when the intensity of solar radiation reaches 1000 watts per square meter. Intuitively, we know PSH is greater during summer months than winter months. We also know that even when we get 8 hours of daylight, the sun is more intense during midday than dawn and dusk.
If we were to measure the intensity of the sun throughout the day. Solar noon should be when sunlight is most intense. That intensity tapers off as you measure closer to the beginning and end of day. It’s possible that around solar noon, we are getting way more than 1000 watts per square meter of solar energy and much less during other times of the day.
Peak sunlight hours redistributes the total solar energy throughout the day and gives a time measurement if each hour produced 1000 watts per square meter. This allows for apples to apples estimates of solar panel output.
Get Global Peak Sun Hours
To get the peak sun hours (PSH) in your region, use the calculator tool below. The calculator takes your address, city, or zip code and sends it to the National Renewable Energy Laboratory to pull historical average peak sunlight hours for your location.
If you are outside of the United States, please click on the international checkbox to ensure the correct data gets pulled.
The results are a list of average peak sun hours by month as well as an average value for the entire year. For people who live further towards the Northern and Southern hemispheres, the winter summer months can vary quite a bit.
If your energy usage is particularly high during the winter, make sure to check your solar system size using December PSH.
Table of Peak Sun Hours by Location
Here, we have a table of peak sun hours by most populated cities. We also chose other locations to give even coverage of various regions across the country.
Peak Sun Hours Map
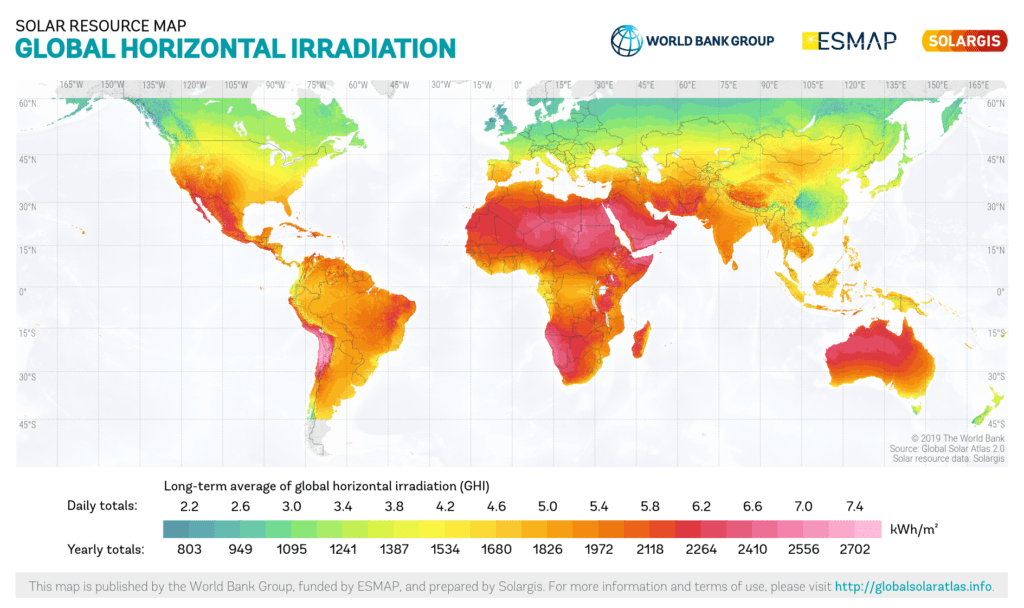
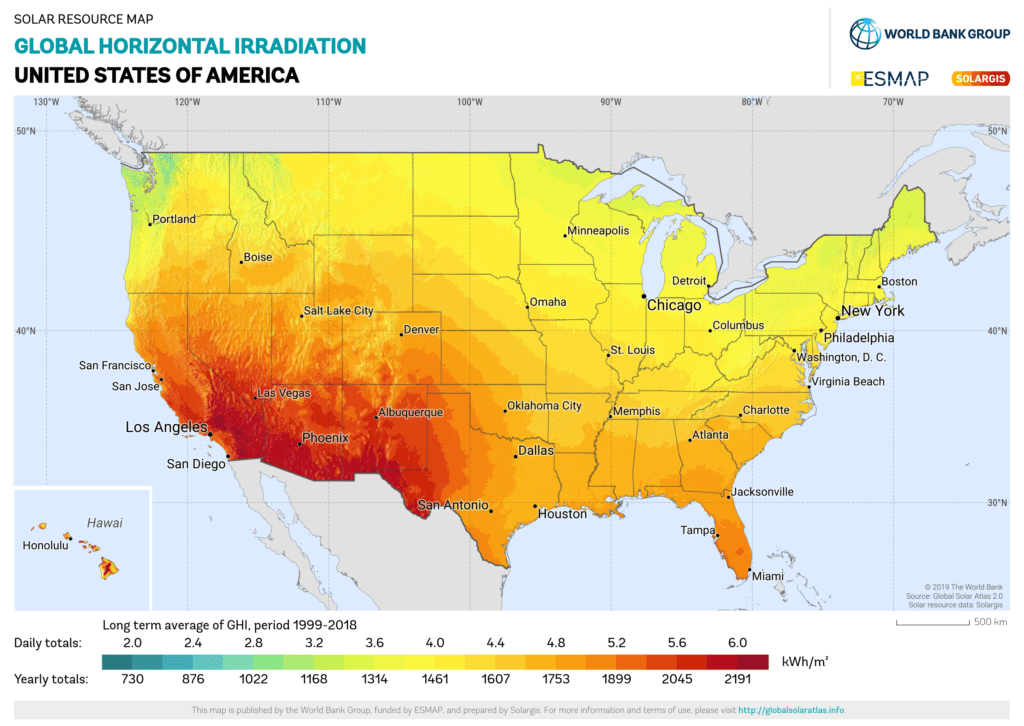
An alternatively way to estimate average daily peak sun hours (PSH) is to look up geographical regions on a Global Horizontal Irradiation Map. You want to match the color to the daily totals.
How To Use Peak Sun Hours
So how does knowing the peak sun hours (PSH) help you calculate solar output? Let’s say you are choosing between 300 watt solar panels and 400 watt solar panels. Your daily load is 20,000 watts or 20 kilowatts. If you get on average 4.5 PSH, you can estimate how many solar panels you might need for your solar installation.
Your daily output per solar panel with 300 watt panels would be
300 W X 4.5 h = 1350 wh or 1.35 kWh
To produce a total of 20 kWh, you need:
20 ÷ 1.35 = 14.8 or 15 solar panels
Your daily output per solar panel with 400 watt panels would be
400 W X 4.5 h = 1800 wh or 1.8 kWh
To produce a total of 20 kWh, you need:
20 ÷ 1.8 = 11.1 or 12 solar panels
Depending on cost and roof space, you can compare estimated daily total energy production.